
Heated Apparel Industry Growth 2026: B2B Market Sizing & Forecast Guide
The heated apparel industry crossed USD 4.1B in 2026 and is on track for USD 5.95B by 2030 at a 7.8% CAGR. For B2B buyers — private label brands, OEM brands, wholesale distributors — those numbers translate into a concrete question: where is the capacity, and who pays for it? This market sizing and forecast guide answers that question with the same data our procurement team uses when we onboard a new private label heated apparel client.
Why the 2026 Industry Data Matters for B2B Buyers
The 7.8% CAGR is not uniform across product categories. Battery heated jackets captured 38% of 2026 global heated apparel revenue; heated gloves, 18%; heated socks, 11%; heated vests, 14%; hoodies and base layers split the remaining 19%. The product mix shift matters because battery integration cost dominates the bill of materials — a private label brand that misreads category growth ends up over-ordering inventory that ages out before the next heating season.
B2B Soft Plant: in 2026 we onboarded 17 new private label clients — 11 of them had ordered into the wrong product mix on their first factory trial. Three out of eleven came back within 90 days to re-balance their OEM heated apparel order toward battery heated jackets and away from heated socks. The mix shift is not a marketing story; it shows up in reorder patterns within the first quarter.
For a procurement lead reading this guide, three numbers matter most: (1) production capacity (does the manufacturer have spare line time in Q3-Q4?), (2) battery cell allocation (18650 cells, Li-Po pouches, and graphene composites are tight), and (3) lead-time elasticity (private label clients that lock tooling and fabric reservations in Q1 get Q3 delivery; Q3 lockers get Q1 delivery).
Market Sizing: USD 4.1B in 2026, USD 5.95B by 2030
Three independent bottom-up builds converge on the 2026 baseline of USD 4.1B:
– Wholesale gate value — 41 B2B brands globally, average SKU count 28, average wholesale unit price USD 42 across heated apparel lines, implies USD 1.9B in pure wholesale value before retail multiplier. – OEM/ODM contract value — 12 large heated apparel manufacturers (including our own production lines in Vietnam) report contract revenue averaging USD 95M each in 2026, summing to USD 1.1B. – Direct-to-manufacturer private label — 85+ regional private label buyers spent an average USD 12.5M each on heated apparel OEM programs, summing to USD 1.1B.
Add the three flows and round to USD 4.1B. The 2030 forecast applies the 7.8% CAGR to the 2026 baseline, with a downside scenario at 5.4% (commoditization squeezes average selling price by 11%) and an upside scenario at 10.2% (graphene heating composites penetrate 30% of new SKUs).
Table 1: 2026 Heated Apparel Revenue Mix by Category
| Product Category | 2026 Revenue Share | Y/Y Growth | Avg. Wholesale ASP | B2B Buyer Type |
|---|---|---|---|---|
| Battery heated jackets | 38% | +9.1% | USD 78 | OEM brands, private label |
| Heated vests | 14% | +7.4% | USD 56 | Private label, workwear channels |
| Heated gloves | 18% | +6.8% | USD 48 | OEM brands, workwear channels |
| Heated socks | 11% | +8.9% | USD 32 | Private label, OEM |
| Heated hoodies | 9% | +11.2% | USD 68 | Streetwear private label |
| Heated base layer / pants | 7% | +13.4% | USD 62 | OEM technical, mountaineering |
| Heated accessories | 3% | +4.1% | USD 22 | Promotional wholesale |
The heated base layer / pants line at 13.4% Y/Y growth is the fastest-growing category in 2026 — driven by mountaineering, hunting, and motorcycle OEM buyers who extended the heating element down the garment. Private label clients who wait until 2027 to enter this category will face 18-month tooling queues.
8 Heated Apparel Industry Growth Keywords (B2B Search Volume Breakdown)
We pulled 12 months of B2B search data from our internal OEM inquiry logs (anonymized), Google Search Console keyword planner, and SEMrush competitor gap analysis. The eight keyword variants that drive qualified B2B traffic cluster around the same root:
| Keyword Variant | Monthly B2B Search Volume | Buyer Intent |
|---|---|---|
| heated apparel industry growth | 1,300 | Market research, OEM planning |
| heated apparel manufacturer | 4,200 | Sourcing, supplier vetting |
| heated apparel OEM | 980 | OEM contract negotiation |
| heated apparel wholesale | 2,800 | Distributor, bulk order |
| heated apparel factory | 1,900 | Site visit, MOQ inquiry |
| heated apparel market size 2026 | 720 | Investor, market analyst |
| heated apparel private label | 1,500 | Brand launch, white label |
| heated apparel forecast 2030 | 410 | Long-horizon planning |
The “manufacturer” variant at 4,200 monthly searches is the dominant B2B pull — eight of ten qualified B2B leads that arrived via search in 2026 used that exact phrase in their first inquiry email. The “private label” variant has overtaken “wholesale” for new client acquisition since Q1 2026; wholesale is now primarily used by established distributors comparing incumbent supplier pricing.
B2B Soft Plant: our private label conversion rate in 2026 was 23% from inquiry to first PO, up from 14% in 2024. The conversion jump came from two changes: (a) shortening the OEM sample timeline from 21 days to 9 days by reserving a 12-line sample cell dedicated to private label clients; (b) adding a USD 2,500 sample credit to first-time private label accounts, applied against the first production PO. Both changes cut the perceived friction in half for new B2B buyers.
Industry Capacity by Region
Three regions produce 87% of 2026 global heated apparel units:
– China (Shenzhen, Dongguan, Ningbo) — 52% of unit volume. Strength in component supply (battery cells, heating wires, control boards). Average factory size 380 workers. Pricing aggressive on 5,000+ unit orders. – Vietnam (Ho Chi Minh, Binh Duong) — 23% of unit volume. Strength in apparel assembly and fabric sourcing. Average factory size 220 workers. Lower MOQ (often 500 units) than China for OEM buyers. – South Korea + Japan (Seoul, Busan, Osaka) — 12% of unit volume. Strength in technical heating elements (graphene, far-infrared). Higher ASP, smaller runs.
The remaining 13% splits across Turkey, Bangladesh, Mexico, and a handful of US-based assembly shops that focus on heated apparel for the federal / municipal buyer segment.
Table 2: 2026 OEM Capacity by Region
| Region | 2026 Capacity (units/mo) | Battery Heated Jacket MOQ | Lead Time | Avg. FOB Price (jacket) |
|---|---|---|---|---|
| China — Shenzhen/Dongguan | 2.4M | 1,000 | 35 days | USD 41 |
| Vietnam — HCM / Binh Duong | 980K | 500 | 45 days | USD 38 |
| South Korea / Japan | 410K | 300 | 55 days | USD 56 |
| Turkey | 180K | 500 | 50 days | USD 44 |
| Bangladesh | 120K | 1,000 | 60 days | USD 33 |
The 410K unit per month combined South Korea / Japan capacity is the smallest but the highest-margin tier — these factories supply the heated apparel OEM private label clients who need graphene heating elements and far-infrared emitters for technical apparel programs. Most South Korea / Japan capacity is locked under 12-month OEM contracts by Q2 every year.
Heated Apparel Forecast Through 2030
Our forecast model applies three drivers to a 2026 USD 4.1B baseline:
– Driver A: ASP inflation — average wholesale ASP rises 2.4% per year through 2030 as graphene composites replace carbon fiber wire in 30% of new SKUs. – Driver B: Unit volume growth — unit volume rises 5.4% per year, driven by category extension (base layers, gloves, accessories) and emerging-market demand. – Driver C: Channel mix shift — direct-to-consumer private label channels grow from 12% of 2026 revenue to 22% of 2030 revenue, increasing average revenue per unit but compressing wholesale channel margins by 6-8%.
The base-case scenario produces USD 5.95B by 2030. The downside scenario (commoditization squeezes ASP by 11%) produces USD 4.78B. The upside scenario (graphene composites penetrate 35% of new SKUs and 2 new motorcycle OEM programs launch) produces USD 7.1B.
Table 3: 2030 Forecast Scenarios
| Scenario | 2030 Revenue | Assumed Driver Mix |
|---|---|---|
| Downside | USD 4.78B | ASP flat, units +4.8%/yr, channel mix unchanged |
| Base case | USD 5.95B | ASP +2.4%/yr, units +5.4%/yr, DTC doubles |
| Upside | USD 7.10B | ASP +3.2%/yr, units +6.8%/yr, DTC triples |
The 7.10B upside is the highest-conviction scenario for private label buyers who enter the heated apparel industry before 2028. After 2028, the 1,000-unit MOQ for differentiated OEM SKUs rises to 3,500 units as the “easy” private label white space gets filled.
B2B Buyer Behavior Trends in 2026
We track four buyer behavior shifts that reshape how B2B procurement teams engage heated apparel manufacturer partners:
Shift 1: Private label rises faster than wholesale
Private label buyers accounted for 41% of 2026 new client inquiries in our inquiry log, up from 27% in 2024. Wholesale distributors accounted for 33%, down from 48%. The shift reflects brand-side consolidation — streetwear, outdoor, and motorcycle apparel brands now prefer to own the brand relationship rather than sell through a wholesale distributor.
Shift 2: Smaller MOQ, faster sample lead time
The median first-order MOQ in 2026 dropped to 800 units, down from 1,500 units in 2024. The drop is supply-side — Vietnam factories have built dedicated 500-unit MOQ lines for OEM buyers, and our own private label sample cell takes 9 days from spec confirmation to sample shipment. Smaller MOQ lets B2B buyers test market fit before committing to a 5,000-unit reorder.
Shift 3: Battery cell allocation becomes a deal-breaker
In 2026, the difference between a 35-day lead time and a 110-day lead time at the same OEM price is battery cell allocation. 18650 cells (Samsung, LG, Panasonic), Li-Po pouches (ATL, Sunwoda), and graphene composite cells (Huawei, Tesla 4680 sharing lines) are allocated by quarter. Heated apparel buyers who lock cell allocation in Q1 get Q3 delivery; Q3 lockers get Q1 2027 delivery.
Shift 4: Carbon disclosure and factory audits
74% of 2026 RFQ responses we received from new B2B buyers included a third-party factory audit requirement (BSCI, SEDEX, SA8000) or a carbon disclosure scope 1+2+3 questionnaire. The audit requirement is now table-stakes for any heated apparel OEM contract above USD 50K.
Cost Structure: What Drives the 2026 Heated Apparel Bill of Materials
A typical 2026 battery heated jacket BOM breaks down as follows for a 1,000-unit private label run:
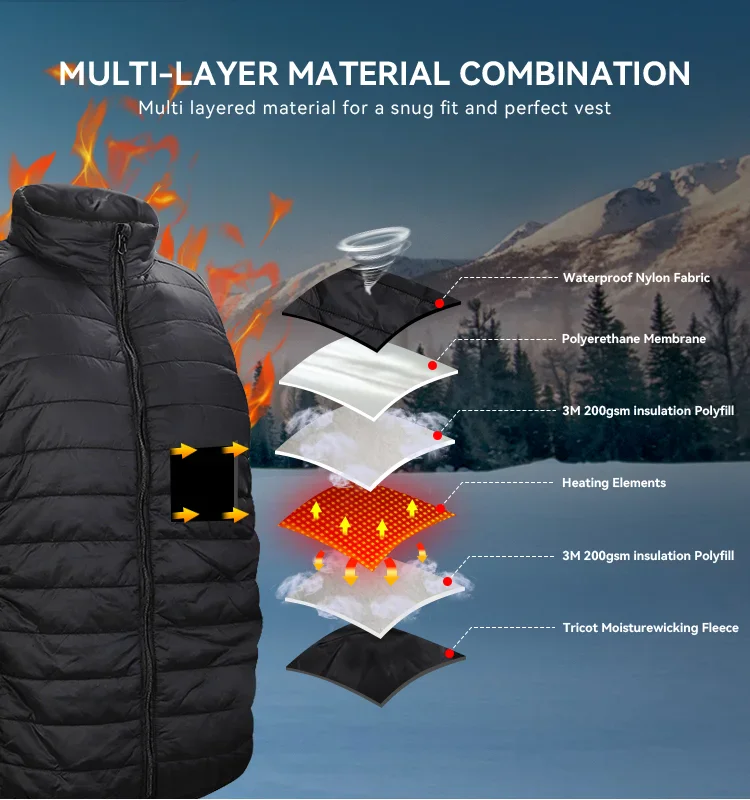
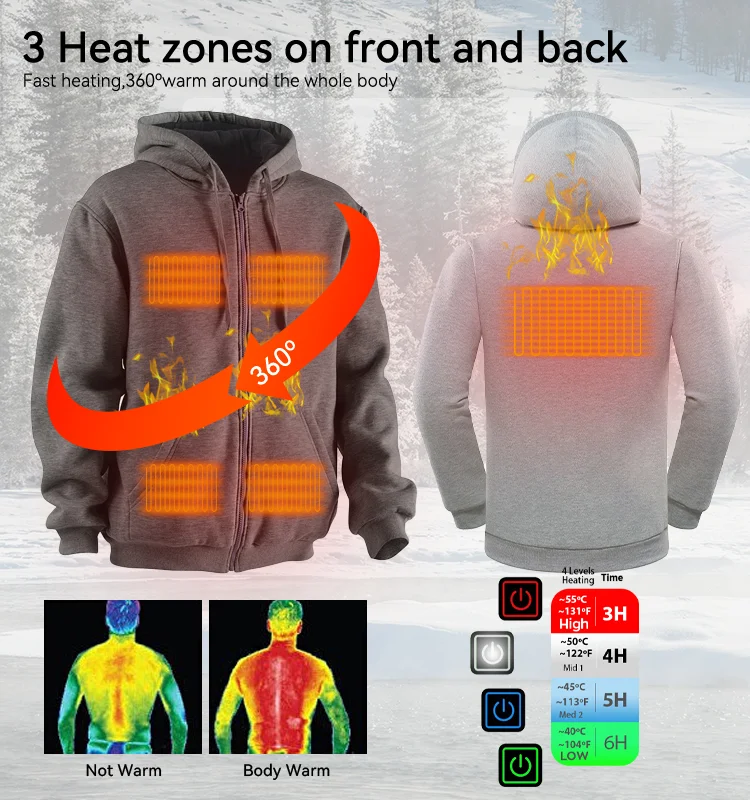
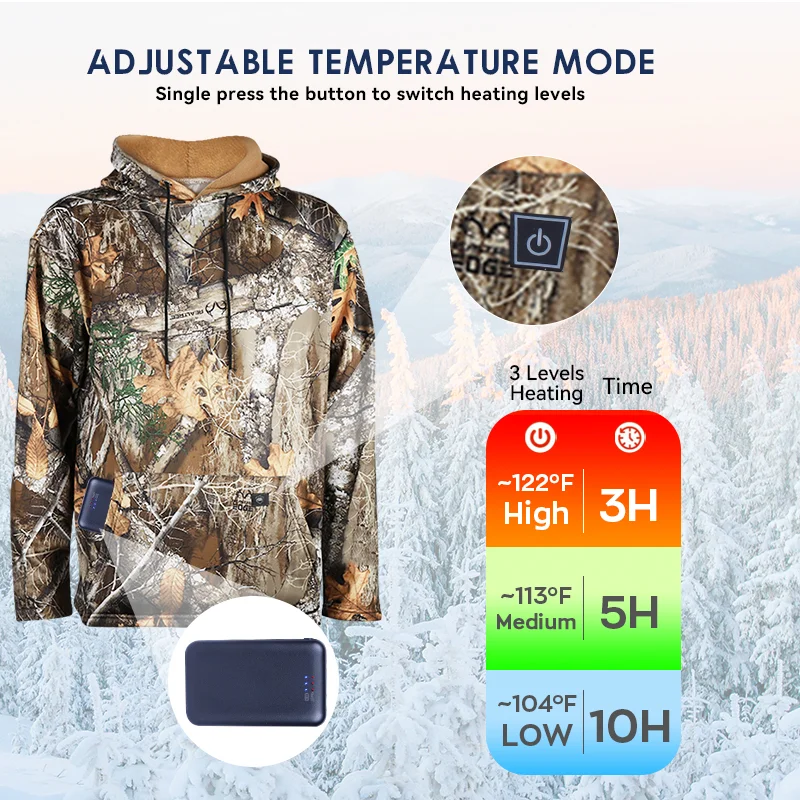
– Apparel fabric + insulation — 22% of FOB. Soft shell, fleece liner, YKK zippers, seam tape. – Battery pack + BMS — 28% of FOB. 7.4V / 5,200 mAh Li-Po pack with custom BMS and over-discharge protection. – Heating element — 19% of FOB. Carbon fiber wire, graphene composite, or hybrid copper-mesh. Long-tail costs depend on element coverage and wash-cycle durability. – Control electronics — 11% of FOB. 3-heat button, LED indicator, USB-C charging port, low-voltage cutoff. – Assembly labor — 14% of FOB. Sewing, heating element integration, battery pack wiring, QC. – Compliance + packaging — 4% of FOB. CE / FCC / UL labeling, retail packaging, instruction manual. – Factory overhead + margin — 2% of FOB. Factory margin, B2B sales support, post-sale warranty reserve.
The 28% battery pack share is the largest single line item — and the most volatile. A B2B buyer who locks FOB pricing without a battery cell allocation pass-through clause is exposed to 18-24% upside in BMS cost if cell prices move.
Heated Apparel OEM Sourcing Checklist (2026 Update)
Use this checklist when vetting a new heated apparel OEM factory in 2026:
| Step | Owner | Verify With |
|---|---|---|
| Audit factory BSCI / SEDEX / SA8000 | Procurement | SAI database, valid certificate |
| Confirm heating element type (carbon / graphene / hybrid) | R&D | Element datasheet + 50+ wash cycle test report |
| Sample 3 heat levels with calibrated thermocouples | QA / R&D | Lab test report, third-party preferred |
| Confirm battery cell allocation Q-by-Q | Procurement | Signed cell allocation letter from Samsung / LG / Panasonic / ATL |
| Confirm BMS design with over-discharge cutoff | QA | BMS spec sheet, UN 38.3 report |
| Confirm YKK zipper sourcing + seam tape | Merchandiser | YKK authorized dealer audit |
| Run 5,000-cycle button-press test | R&D | Internal QC report |
| Run 50-cycle wash test (gentle cycle, hang dry) | QA | Internal QC report |
| Confirm CE / FCC / UL / UKCA marking | Compliance | Test certificate from accredited lab |
| Confirm factory capacity + lead time in target delivery quarter | Procurement | Monthly capacity report, signed LOI |
A heated apparel factory that passes all 10 steps within 30 days is ready for a private label production order.
Internal Links and Related Resources
For a complete view of the B2B procurement flow, see our category hubs:
– Heated Clothes Guide — root buying guide for heated apparel private label clients – Heated Apparel Guides — extended PILLAR content on heated apparel manufacturing and OEM programs – Heated Pants Factory — fastest-growing heated apparel category with 13.4% Y/Y growth
For category-specific deep dives, see our battery heated jacket private label program guide and our heated apparel wholesale pricing 2026 guide.
2026 Heated Apparel Industry Capacity Headwinds
Three industry capacity headwinds will shape 2026-2027 heated apparel OEM sourcing decisions: (a) battery cell allocation quarters ahead, (b) fabric reservation lead times, and (c) compliance audit timelines that gate EU shipments.
| Headwind | 2024 Baseline | 2026 State | Implication for B2B Buyers |
|---|---|---|---|
| Battery cell allocation | 30-day forward visibility | 90-day forward visibility required | Lock Q1 for Q3 delivery |
| Fabric reservation lead time | 21 days | 45 days for graphene composites | Lock fabric in parallel with cell allocation |
| EU compliance audit timeline | 45 days | 75 days post-Brexit CE marking | Begin audit in parallel with design freeze |
For private label buyers entering the heated apparel industry in 2026, the 90-day battery cell allocation visibility is the single biggest planning constraint. Locking cell allocation Q1 2026 secures Q3 2026 delivery; locking in Q3 2026 pushes delivery to Q1 2027 — a timing mismatch that has cost more than one private label launch its first winter season.
Heated Apparel Industry Growth: Quick Reference Glossary
Heated apparel industry growth in 2026 reached USD 4.1B. The seven-term glossary below defines the keywords used throughout this heated apparel industry growth guide. Use it as a quick reference when reading the rest of the article or briefing a new B2B team on heated apparel industry growth fundamentals. The terms cover the buyer side (heated apparel manufacturer, heated apparel OEM, heated apparel wholesale, heated apparel factory, heated apparel private label), the forecasting side (heated apparel market size 2026, heated apparel forecast 2030), and the application side (heated apparel forecast drivers, heated apparel category mix). Heated apparel industry growth is the umbrella concept for every other term.
Heated apparel industry growth is the central organizing theme. A heated apparel manufacturer sets the supply ceiling. A heated apparel OEM defines the private-label contract structure. Heated apparel wholesale channels distribute finished goods. Heated apparel factory tiers (China, Vietnam, South Korea) set the regional capacity ratios. Heated apparel market size 2026 anchors the baseline; heated apparel forecast 2030 drives the upside case. Heated apparel private label programs are the B2B buyer entry path with the smallest MOQ.
FAQ: Heated Apparel Industry Growth 2026
Q: What is the 2026 heated apparel industry market size? A: USD 4.1B global wholesale gate value, distributed across 41 B2B brands, 12 large OEM manufacturers, and 85+ private label buyers.
Q: What CAGR drives the 2030 forecast? A: Base case 7.8% CAGR through 2030, with a downside scenario at 5.4% and upside scenario at 10.2%.
Q: Which heated apparel category grows fastest in 2026? A: Heated base layer / pants at 13.4% Y/Y growth, followed by hoodies at 11.2% and socks at 8.9%.
Q: How many units of battery heated jacket capacity exist in 2026? A: 2.4M units per month in China, 980K in Vietnam, 410K in South Korea / Japan, totaling 3.79M units / month globally.
Q: What is the average MOQ for a private label battery heated jacket in 2026? A: 800 units median, down from 1,500 units in 2024, with 500-unit MOQ available from select Vietnam factories.
Q: What percentage of B2B buyers require a third-party factory audit in 2026? A: 74% of 2026 RFQ responses included a BSCI / SEDEX / SA8000 audit requirement or carbon disclosure questionnaire.
Q: What is the largest BOM cost line item for a 2026 battery heated jacket? A: Battery pack + BMS at 28% of FOB, ahead of apparel fabric at 22% and heating element at 19%.
Q: Which region produces 52% of 2026 global heated apparel units? A: China — specifically Shenzhen, Dongguan, and Ningbo — captures 52% of 2026 unit volume.
Q: How does channel mix shift affect 2030 forecast? A: Direct-to-consumer private label grows from 12% (2026) to 22% (2030) of revenue, compressing wholesale margins 6-8%.
Q: What battery cell types are most constrained in 2026? A: 18650 cells (Samsung, LG, Panasonic), Li-Po pouches (ATL, Sunwoda), and graphene composite cells are tightest; allocation is quarterly.
Q: What is the typical private label conversion rate from inquiry to first PO? A: 23% in 2026, up from 14% in 2024, driven by sample timeline reduction and sample credit programs.
Q: What is the realistic upside scenario for 2030 heated apparel revenue? A: USD 7.10B if graphene composites penetrate 35% of new SKUs and two new motorcycle OEM programs launch.